Sebagai profesional anda dapat melakukan plotting pada software komersial seperti Petrel, Geoframe, Omega2-Attribute Display atau MS-Excel.
Untuk keperluan quick-qc, Unix menyediakan berbagai macam perangkat plotting gratis diantaranya xgraph, ygraph, gnuplot, dll.
Pada bagian ini, saya akan menjelaskan penggunaan gnuplot untuk memplot data dengan format XYZ (data well, peta struktur, gravity, dll).
Anda dapat men-check apakah anda memiliki gnuplot atau tidak dengan which gnuplot atau man gnuplot
Jika anda belum memiliki, anda bisa mengistallnya dengan perintah sudo apt-get install gnuplot-x11 (untuk Ubuntu 10.10).
Berikut adalah contoh plotting data.txt
head -5 data.txt
0 0.0000000000 1.000000000
1 0.0174524064 0.999847695
2 0.0348994967 0.999390827
3 0.0523359562 0.998629534
4 0.0697564737 0.997564050
Panggil gnuplot dengan perintah gnuplot, sehingga diperoleh gnuplot>
set xlabel 'XLABEL'
set ylabel 'YLABEL'
set xrange [0:360]
set yrange [-1:1]
plot "data.txt" using 1:2 title 'SIN' pointtype 3 pointsize 1 , "data.txt" using 1:3 title 'COS' pointtype 6 pointsize 1
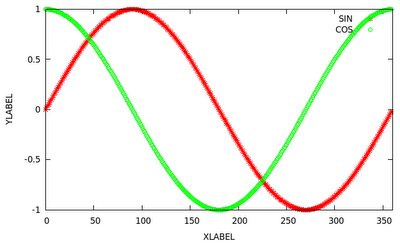 set xlabel 'XLABEL' membuat label X, set ylabel 'YLABEL' membuat label Y, set xrange [0:360] membatasi range X dari 0 s/d 360, set yrange [-1:1] membatasi rentang Y. using 1:2 (menggunakan kolom 1 untuk X dan kolom 2 untuk Y), pointtype dan pointsize menunjukkan tipe point dan ukurannya. Anda bisa mencoba berbagai tipe 1 s/d 7 atau size dari 0.1 s/d 6 (misalnya).
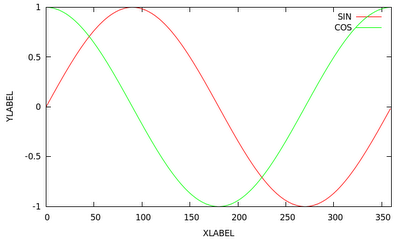
Untuk memperoleh plot garis, saya menggunakan with lines.
plot "data.txt" using 1:2 title 'SIN' with lines, "data.txt" using 1:3 title 'COS' with lines
 gnuplot dapat dipanggil melalui shell (tanpa harus berada di terminal gnuplot).
Berikut contoh shell untuk plotting data di atas.
#!/bin/sh
gnuplot -persist <<PLOT
set xlabel 'XLABEL'
set ylabel 'YLABEL'
set xrange [0:360]
set yrange [-1:1]
plot 'data.txt' using 1:2 title 'SIN' with lines, \
'data.txt' using 1:3 title 'COS' with lines
quit
PLOT
Untuk data grav.xyz anda dapat mengestraknya di sini.
Sehingga saya memperoleh:
head -8 grav.xyz
100.0083 -0.0082 36.20
100.0250 -0.0082 30.80
100.0417 -0.0082 26.40
100.0583 -0.0082 23.90
100.0750 -0.0082 23.80
100.0917 -0.0082 25.50
100.1083 -0.0082 28.40
100.1250 -0.0082 31.20
Panggil gnuplot, lalu copas (copy-paste) kode berikut pada terminal gnuplot
set key off
set view 0,0
set xrange [100:102]
set yrange [-2:0]
set xlabel 'X-Coordinate'
set title "Gravity Map"
set palette model RGB rgbformulae 7,5,15
splot 'grav.xyz' using 1:2:3 with points palette pointsize 1 pointtype 7
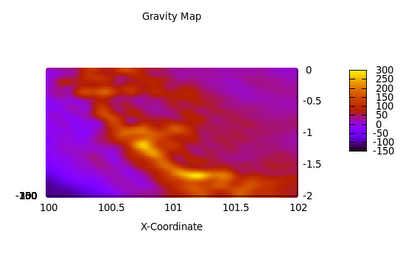 Anda bisa merotasinya dengan meng-klik icon dua-panah yang menyerupai yin-yang, sehingga diperoleh gambar 3-D.
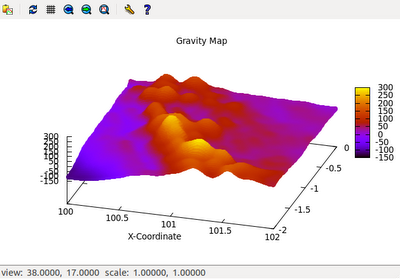
gnuplot memiliki fleksibilitas yang tak kalah dari matlab. Berikut contohnya:
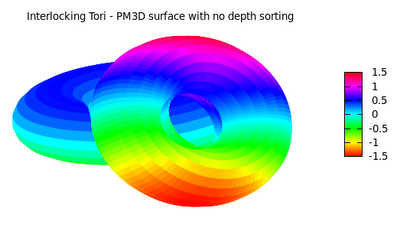 Berikut adalah kode untuk gambar di atas:
unset border
set dummy u,v
unset key
set palette model HSV rgbformulae 3,2,2
set parametric
set view 60, 30, 1.1, 1.33
set isosamples 50, 20
set noxtics
set noytics
set noztics
set title "Interlocking Tori - PM3D surface with no depth sorting"
set urange [ -3.14159 : 3.14159 ] noreverse nowriteback
set vrange [ -3.14159 : 3.14159 ] noreverse nowriteback
set xrange [ * : * ] noreverse nowriteback
set yrange [ * : * ] noreverse nowriteback
set zrange [ * : * ] noreverse nowriteback
set cbrange [ * : * ] noreverse nowriteback
set pm3d scansbackward
set colorbox vertical origin screen 0.9, 0.2, 0 size screen 0.05, 0.6, 0 front bdefault
f(x,y) = sin(-sqrt((x+5)**2+(y-7)**2)*0.5)
splot cos(u)+.5*cos(u)*cos(v),sin(u)+.5*sin(u)*cos(v),.5*sin(v) with pm3d, 1+cos(u)+.5*cos(u)*cos(v),.5*sin(v),sin(u)+.5*sin(u)*cos(v) with pm3d
#courtesy: gnuplot.sourceforge.net

No comments:
Post a Comment